

04 Geology Services
Development Well Planning & Reservoir Model QC
Well plans, regulatory volume inputs and model checks that hold up from prognosis to simulation.
Deliverable Well-planning volume inputs, Sw updates and a QC’d, handoff-ready grid for reservoir engineering.
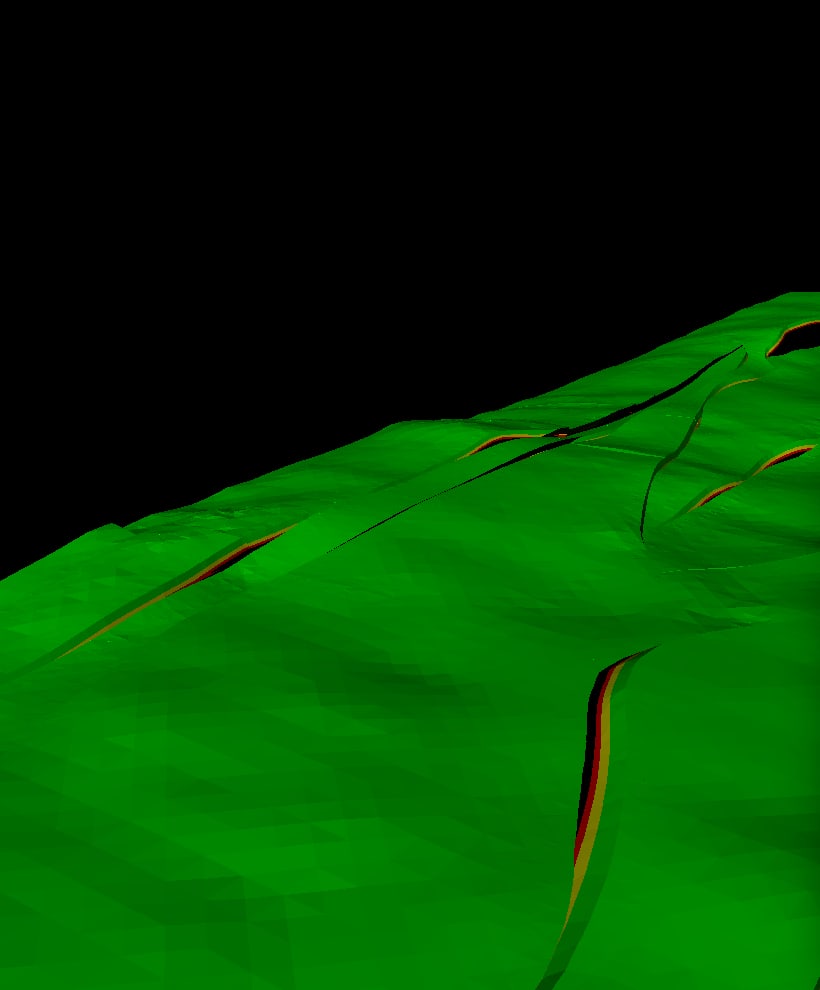

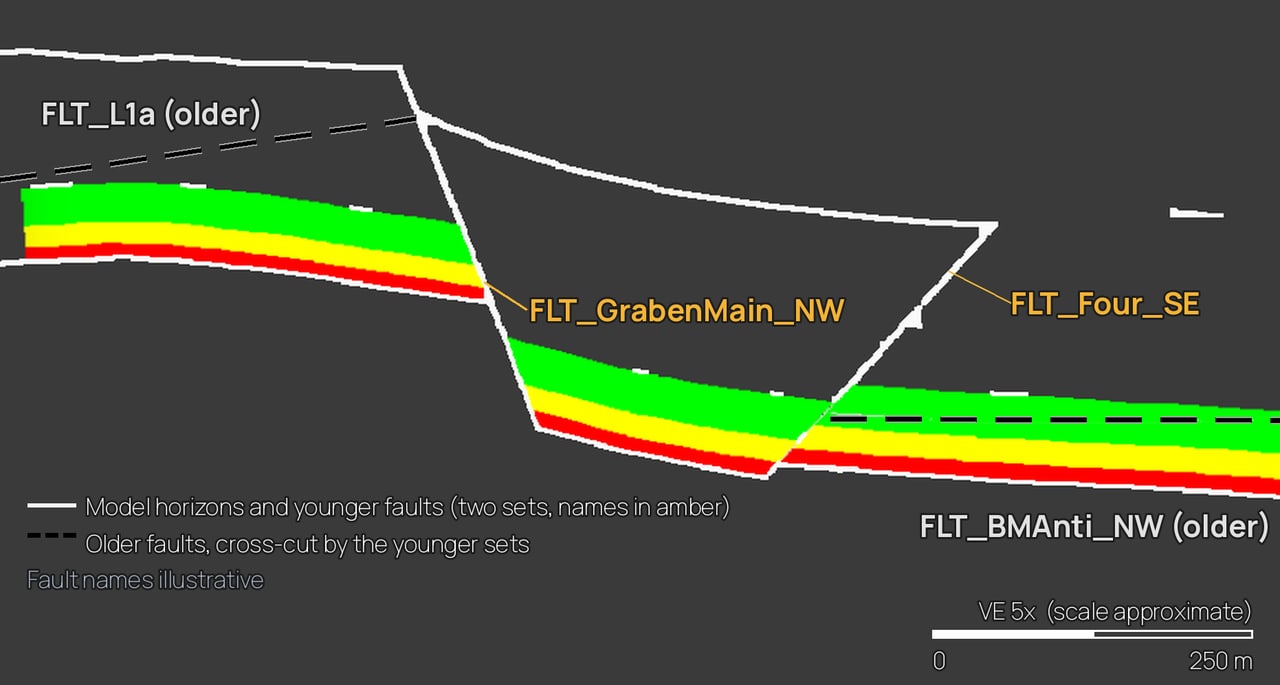
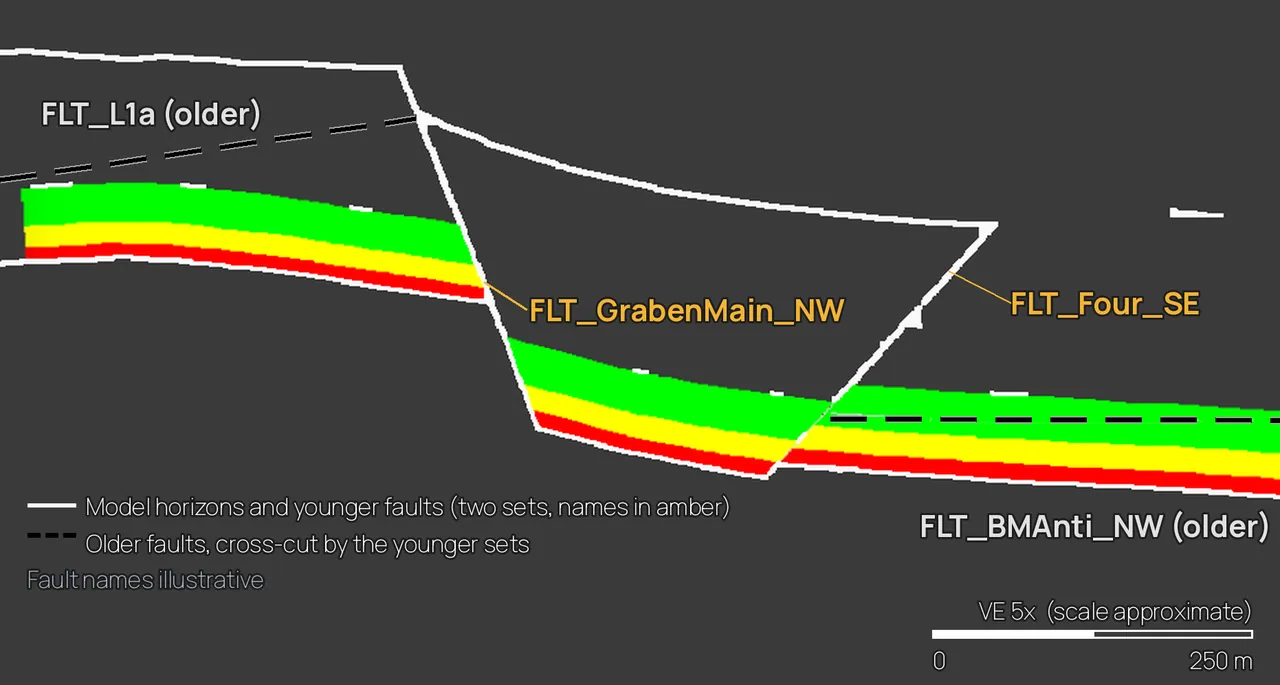
Proof Verified a deepwater well's geologic prognosis by remapping the overburden on the best seismic volumes and checking it against image-log dips and biostratigraphy, then simplified the TD decision trees into a format the team adopted as a standard.
4.1
Well Planning & WCD Volumetric Foundation
Well placement against faults and contacts, and a defensible Worst Case Discharge (WCD) volume basis for your BOEM plan, fast.
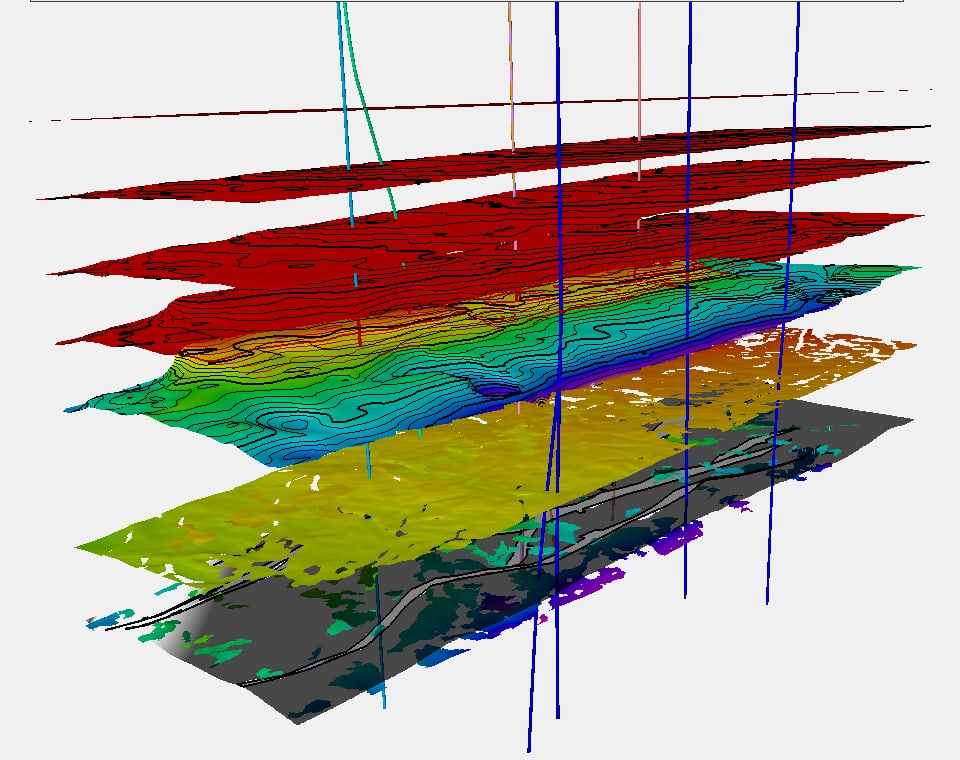
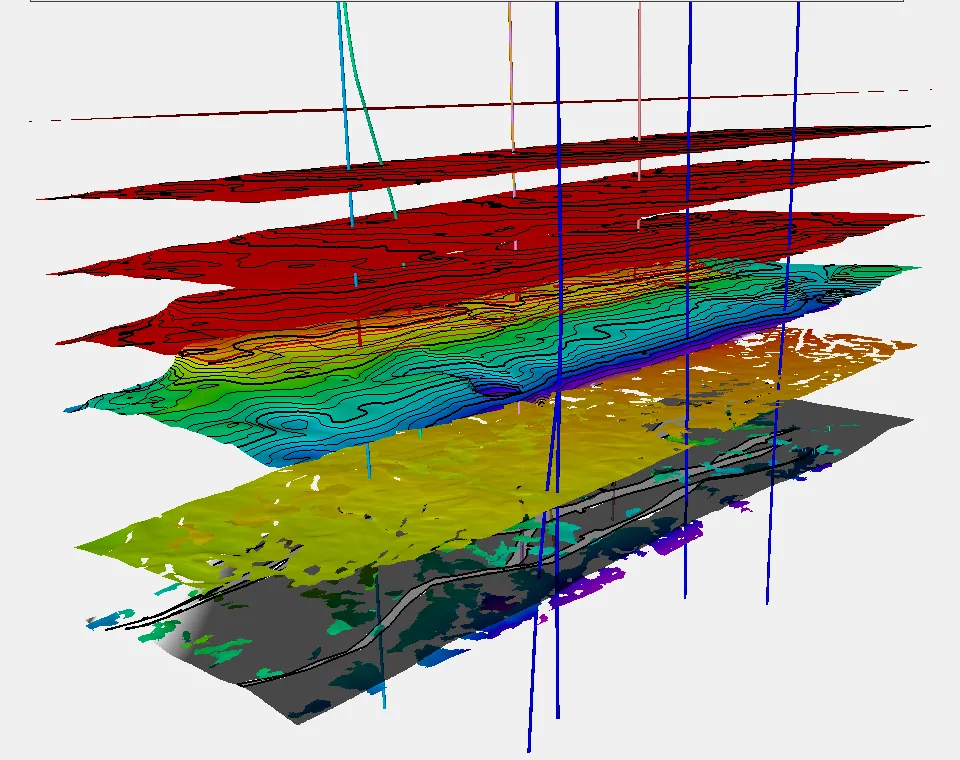
Scope
- Well placement against faults and fluid contacts
- Overburden and target permeable zones mapped in Petrel from stratigraphy and structure
- Fast zone averaging of the petrophysicist’s VSH, PHIT and SWT with cutoffs, weighted by distance to offset wells
- Bulk rock volume, porosity and Sw per zone, in pointset format; Dietz shape factor calculated in Prosper, ready for the WCD model
Proof During a deepwater sidetrack, I re-evaluated the target using image-log and fault interpretation; the re-planned sidetrack avoided the fault the previous attempt had hit.
Deliverable
Zone-by-zone WCD inputs and well-placement maps.
Who it's for
Deepwater GoA operators and well-planning teams preparing exploration or development plans (WCD is a BOEM plan requirement).
Proof
“Built a Petrel workflow to rapidly update and display petrophysical zone averages spatially for development decisions.” Well planning on deepwater wells “delivering WCA, petrophysical summaries, regulatory support,” and a “stratigraphic-to-seismic characterization of 4,000+ ft of overburden.”
What I'm Really Good At
- I know what a drilling team and a regulator each need from the subsurface, and I integrate offset-well petrophysics, structure and stratigraphy into both without slowing the plan.
- At BP I planned, executed and reviewed deepwater wells, delivering WCA, petrophysical summaries and regulatory support.
4.2
Seismic-Conditioned Reservoir Properties / Pseudo-4D
Geomodel properties conditioned to seismic response: where the oil still is, without shooting a 4D survey.
Scope
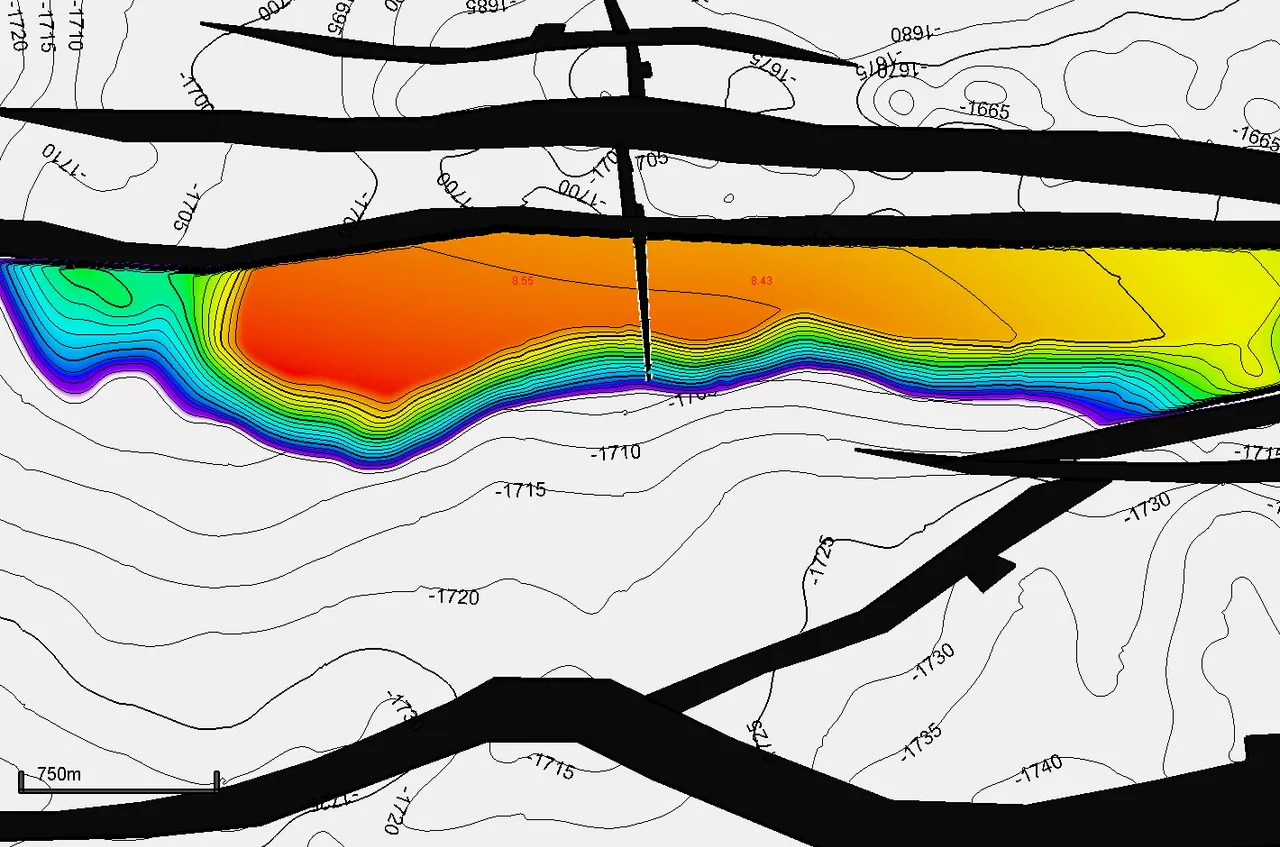
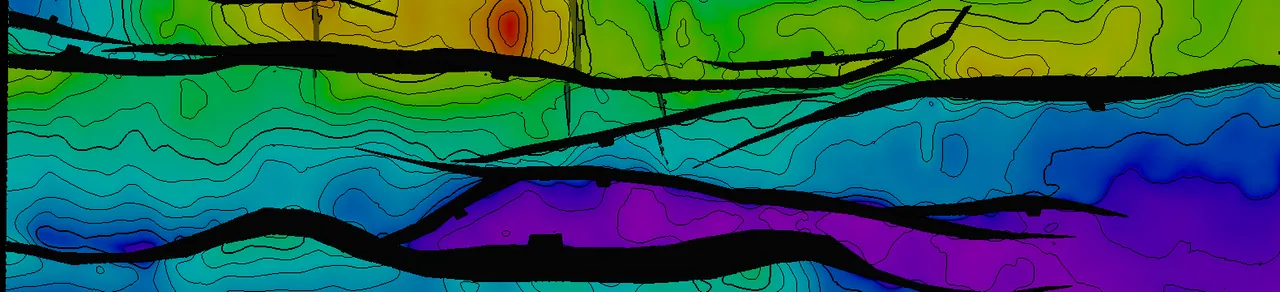
- Conditioning geomodel properties to seismic response: property population and water-saturation updates based on seismic response
- Velocities from Elastic FWI (EFWI) and PLT zonal information (with zonal-allocation datasets) used to calibrate water saturation for remaining-fluid-in-place estimates
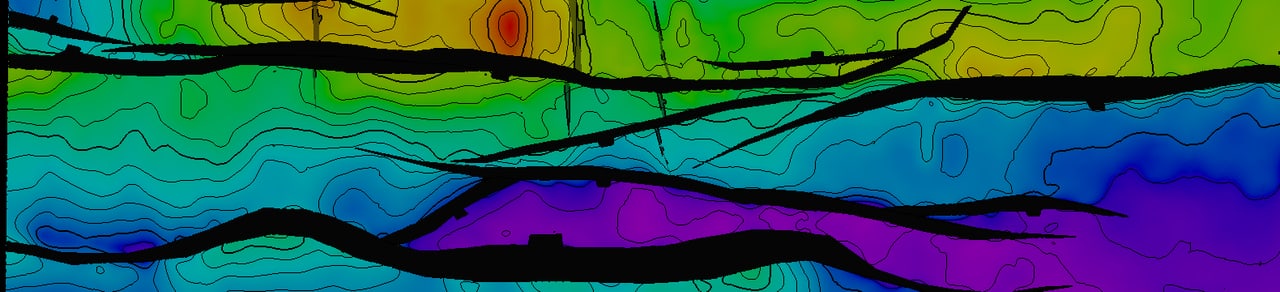
- Structural fabric scenarios integrated into the mix to explain water-cut phenomena and identify infill opportunities alongside injection potential
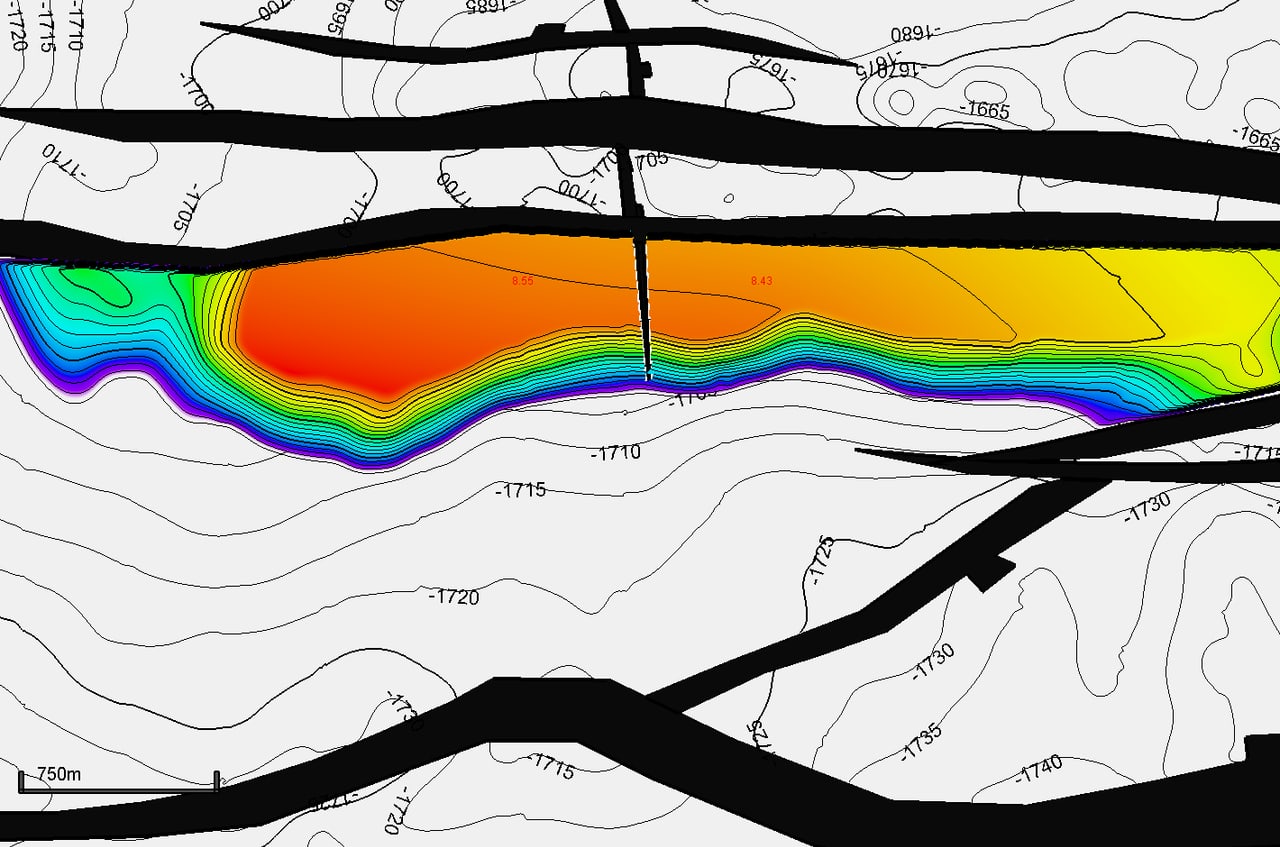
- Seismic net pay maps built from AmpH and minimum amplitude, calibrated with well petrophysics
- STOIIP vs. remaining-HC maps showing where the sweep has and hasn’t reached; volumes ready for infill targeting, simulation refresh and full economic valuation
Proof Built alternate geological scenarios using an advanced velocity model and production-logging surveillance data, which challenged prior assumptions about how one flank of a waterflood was being swept.
Deliverable
Seismic-conditioned Sw and property models, seismic net pay maps, and remaining-HC maps and volumes.
Who it's for
Producing fields under waterflood or depletion with modern velocity or amplitude data but no 4D seismic.
Proof
Field case: seismic net pay maps from AmpH and minimum amplitude, calibrated with well petrophysics, on the Ursa deepwater field.
What I'm Really Good At
- Conditioning geomodel properties to seismic response is exactly what I do well.
- I have used the velocities in Elastic FWI and PLT zonal information to calibrate water saturation for remaining-fluid-in-place estimates, and integrating structural fabric scenarios into that mix proved a powerful way to explain water-cut behavior and find infill opportunities alongside injection potential.
4.3
Fault Transmissibility & Simulation Handoff
Faults built for the simulator: segmented ends, geologic realism, ready to history match.
Scope
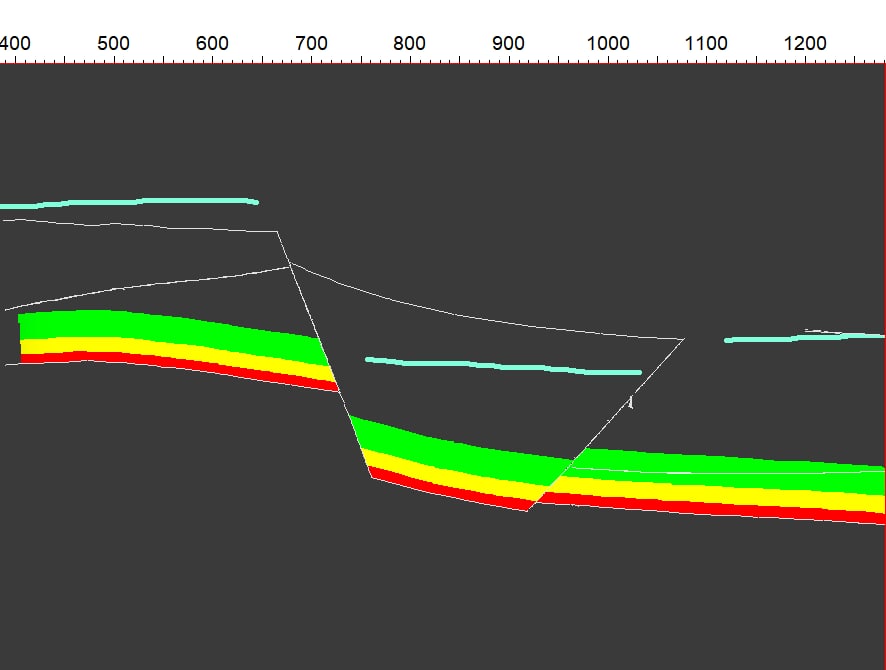
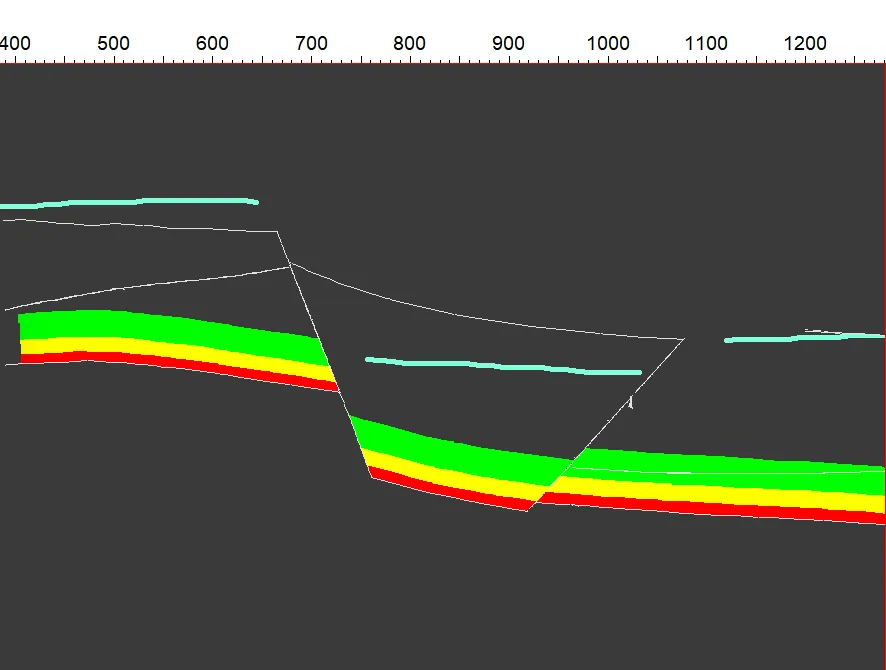
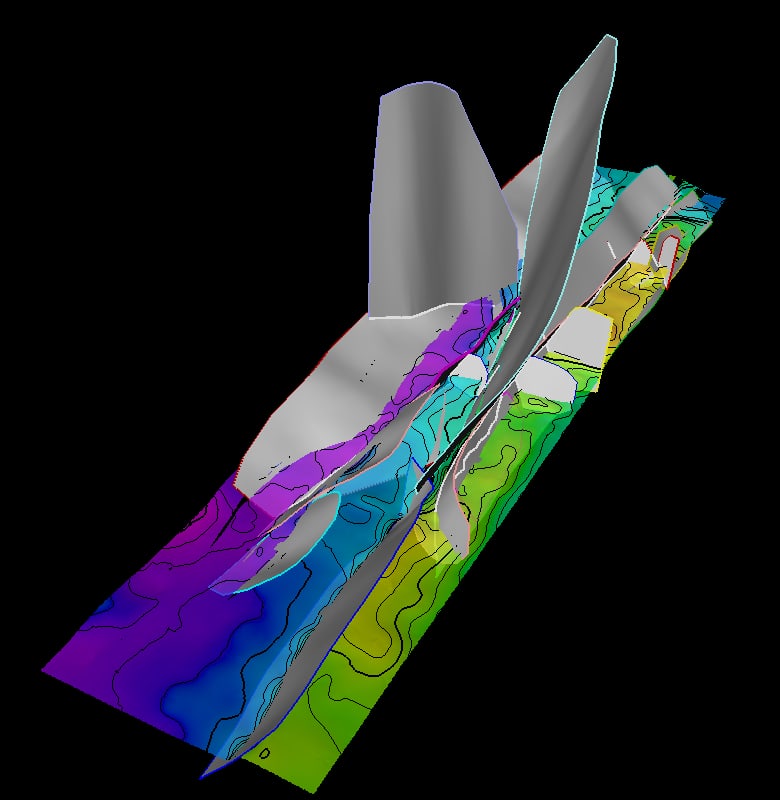
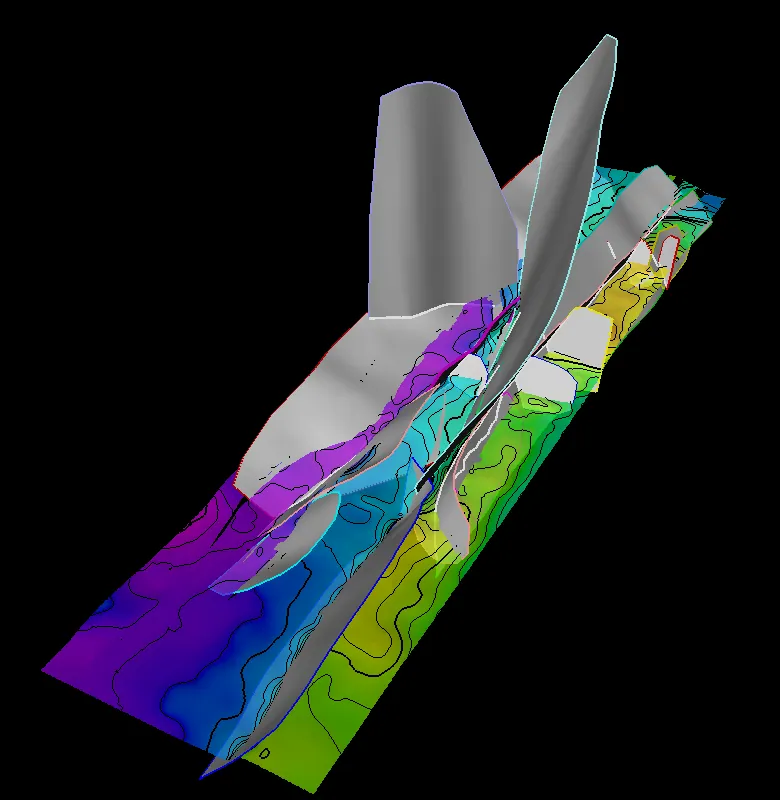
- Faults built with segmented ends that keep geologic realism for simulation fault ingestion and history matching
- Transmissibility multipliers (TMULTs) consistent with structural analogs
- Fault segmentation with confidence and positioning, ready for reservoir-engineering ingestion
- Model QC with zone filters and seismic ties; handoff-ready grids for reservoir engineering
Proof Hosted a two-day static-and-dynamic model fitness review (May 2024) that aligned geology and reservoir engineering on what the full-field model needed next.
Deliverable
A QC’d fault model, TMULTs and grid, packaged for simulation and history match.
Who it's for
Teams handing a static model to simulation, or refreshing a history match on a faulted field.
Proof
Mad Dog, case in point: “Built the full-field M8–M25 structural framework in Petrel + RMS (8 horizons; CC–FF zones; 280+ faults) with rigorous QC and documentation.” “Integrated the static description into the full-field simulation refresh and history match, including fault segmentation, confidence, and positioning for RE ingestion.”
Model fitness checks
I conduct model fitness checks on both the static and dynamic sides. Statically, I review the stratigraphic, structural and depositional frameworks and the rock and fluid properties against static-model best practices. Dynamically, I work with reservoir engineering to test the system and aquifer energy, recovery, sweep and connectivity assumptions that drive well performance.
May 2024: hosted a multi-day, multidisciplinary model fitness review covering both static and dynamic fitness, which set the scope for a full-field structural framework rebuild.
What I'm Really Good At
- I am comfortable building faults with segmented ends that keep geologic realism and still load cleanly into the simulator for fault ingestion and history matching.
- I also transfer frameworks between Petrel and RMS and populate properties for simulation, so the handoff arrives as one clean package.
Synthetic demonstration data: all datasets shown were built solely for demonstration purposes and are not client data.
How to engage
Start small, prove value on one block, then scale. Fast turnaround, remote, Houston-based.
30-minute fit call
We walk through your field, data and decision. You leave with a clear view of where the subsurface risk sits and whether I am the right fit.
Fixed-scope pilot
One fault block or one zone, fixed price and fixed scope. You see my framework, zone averages, maps and QC on your own data before committing further.
Full study
Field-wide framework, correlation, mapping and volumetrics, with handoff-ready grids for reservoir engineering.
Remote delivery · Houston, TX · Petrel and RMS on your license or mine