

02 Geology Services
Well Correlation & Petrophysical Integration
Tops, logs, image logs and petrophysical zone averages reconciled into one QC’d database across every deviated well.
Deliverable A correlated tops database plus correlation panels.
2.1
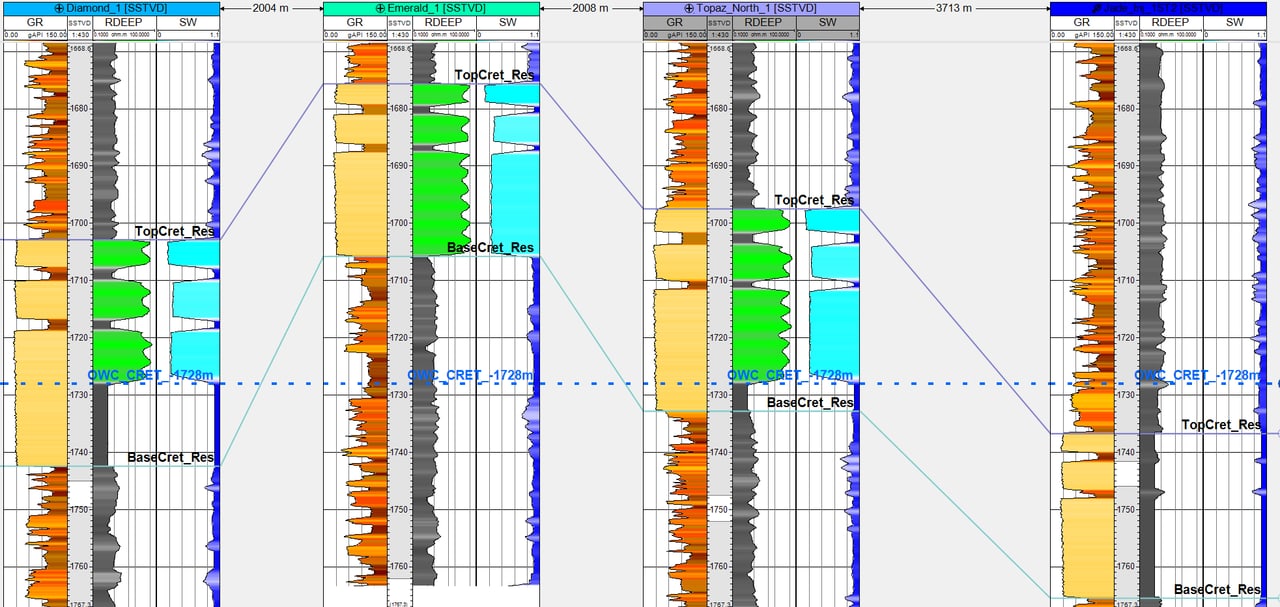
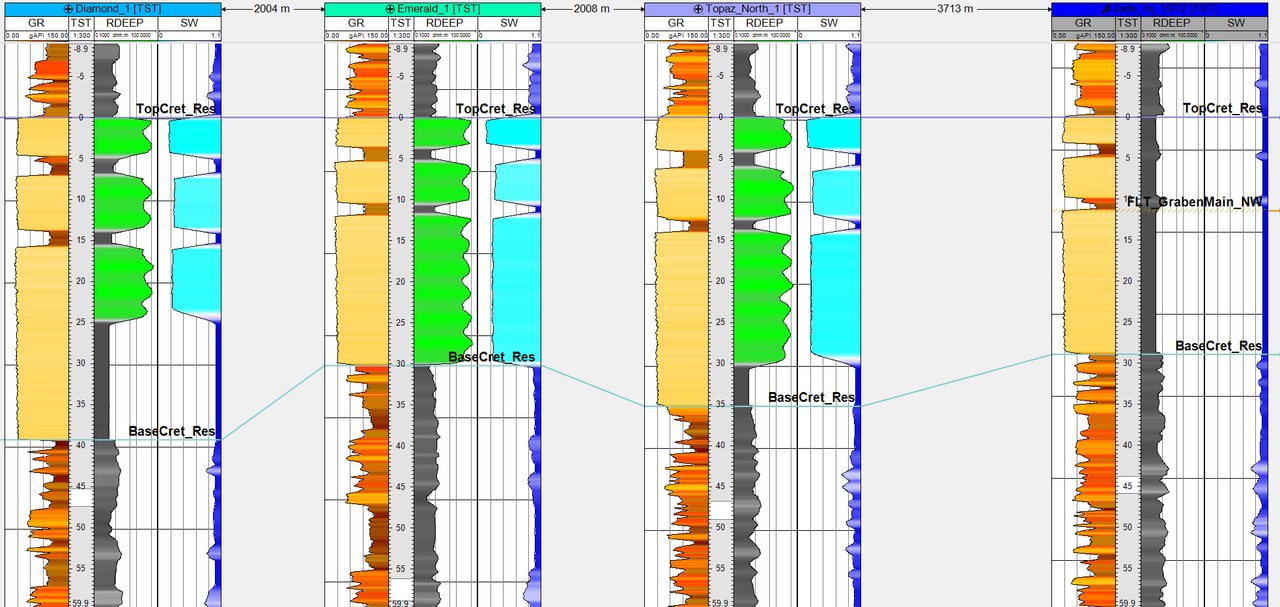
Tops Picking, Fault Cuts & Correlation Panels
Consistent tops in every well, including the hard ones.
Scope
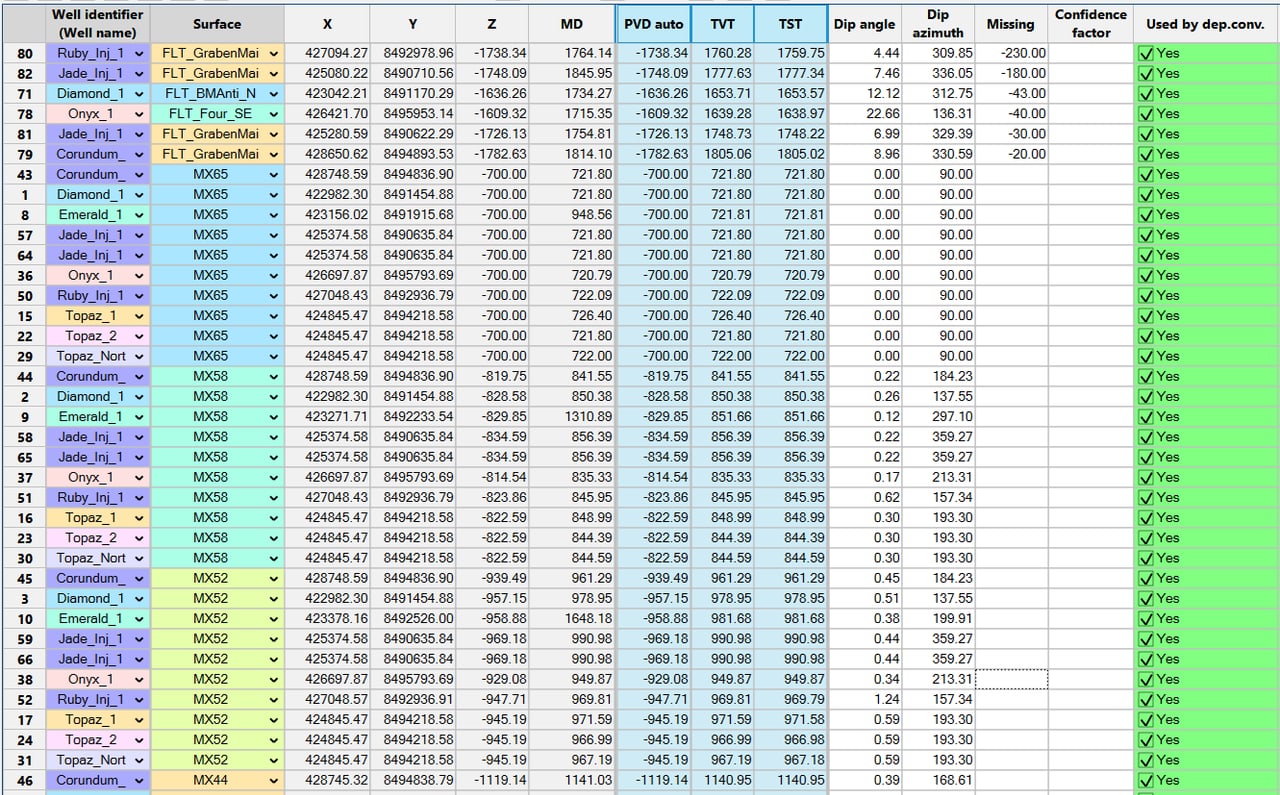
- Tops picking and QC across deviated wells
- Fault-cut identification: dip / azimuth and missing section
- TST / TVT zonation by zone
- GR, RDEEP and Sw log integration; fluid contacts (OWC / GOC) carried onto the panels
Proof Refreshed full-field thickness mapping by reinterpreting dozens of sub-seismic well faults and moving correlations from a lithostratigraphic to a chronostratigraphic framework; the maps met regulatory commingling requirements.
Deliverable
A correlated, QC’d tops database plus correlation panels.
Who it's for
Asset teams inheriting tops from several interpreters, or adding new wells to a mature field.

What I'm Really Good At
I am a data wrangler: tops from different interpreters, vintages and sources get reconciled into one consistent database before anything is mapped. My data-QC habits go back to testing Landmark DecisionSpace and GeoProbe, and at BP I set the modeling and QC workflows for a 14-geoscientist Petrel Studio project.
2.2
Stratigraphy: Image-Log, Log & Seismic Well-Top Harmonization
Tops that agree across image logs, logs and seismic. Combined with, and linked to, structural geomodeling.
Scope
- Depositional fabric to log facies
- Machine-learning-assisted depositional-environment interpretation
- Mapping at subregional-to-local scales
- SLB Quanta Geo image-log interpretation integrated with seismic response, reducing overburden drilling risk and enabling more effective well planning
- Well tops linked to the structural geomodel, so framework updates and tops stay in step
Proof Taught on the first run of a multi-day paralic geology field course, with a 200-plus-page field guide and excellent attendee ratings, and spoke at an image-log workshop on the value of image logs.
Deliverable
Harmonized well tops with facies and environment calls, mapped at the scale you need.
Who it's for
Teams planning wells through complex overburden, or reconciling tops between disciplines.
Core integration
I've participated in about two dozen core workshops and facilitated four to five of them with multidisciplinary teams, integrating core description, image facies and depositional environments to predict flow units and reservoir performance.

What I'm Really Good At
I trained in sedimentology and stratigraphy, so I read depositional fabric first and then tie it to logs and seismic. At BP I completed a stratigraphic-to-seismic characterization of 4,000+ ft of overburden using Quanta Geo image logs, published as an internal integration standard.
2.3
Well Pointsets: Zonal Thickness & Petrophysical Zone Averages
Spatial representation of well information is critical to mapping initiatives and modeling efforts.
Scope
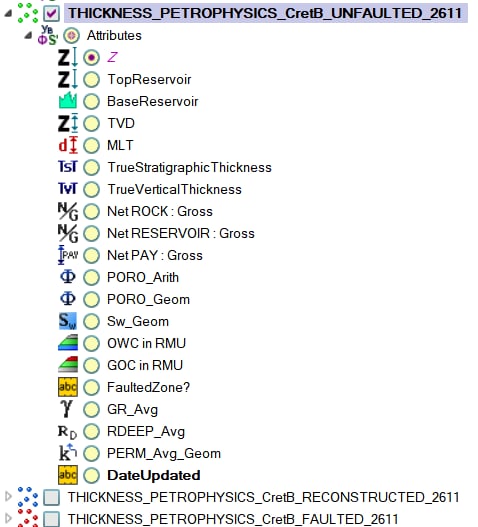
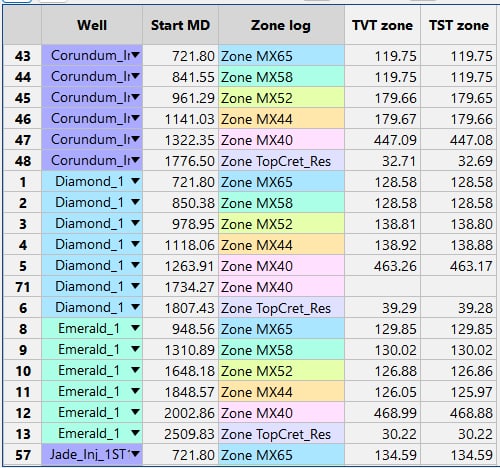
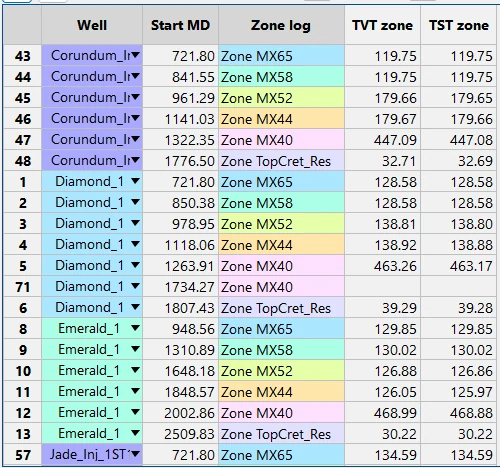
- Pointsets that carry, at every well, zonal thickness (TST / TVT) and petrophysical zone averages: N:G, net pay, PORO, Sw, PERM, GR and RDEEP averages, and OWC / GOC contacts
- Each point flagged as unfaulted, reconstructed or faulted, so fault-affected thickness never contaminates a map
- True TVT tied to image logs and seismic dip / azimuth; image-log dips calibrated to seismic
- The same pointsets feed thickness and property maps, volumetrics and 3D property models
Deliverable
Maps plus spreadsheets, built to be easily maintained and updated as new wells are drilled.
Who it's for
Asset teams on deviated or high-dip wells, where measured thickness overstates the reservoir.
Data wrangler and integrator
I pull messy, multi-source subsurface data (well logs, tops, image logs, seismic, maps, core and production) into one consistent model that geologists, petrophysicists and reservoir engineers can all trust. At BP I served as the G&G–reservoir engineering integrator for deepwater Gulf of America fields, led full-field 3D static modeling, and administered a Petrel Studio project for 14 geoscientists. My specialty is petrophysical zone averaging and thickness mapping in structurally complicated, faulted fields.

What I'm Really Good At
Building well pointsets is where my data-wrangling pays off: thickness and petrophysical zone averages for every well and zone, in one place, mapped where the wells actually are. At BP I built a Petrel workflow that rapidly updated and displayed petrophysical zone averages spatially for development decisions.
Synthetic demonstration data: all datasets shown were built solely for demonstration purposes and are not client data.
How to engage
Start small, prove value on one block, then scale. Fast turnaround, remote, Houston-based.
30-minute fit call
We walk through your field, data and decision. You leave with a clear view of where the subsurface risk sits and whether I am the right fit.
Fixed-scope pilot
One fault block or one zone, fixed price and fixed scope. You see my framework, zone averages, maps and QC on your own data before committing further.
Full study
Field-wide framework, correlation, mapping and volumetrics, with handoff-ready grids for reservoir engineering.
Remote delivery · Houston, TX · Petrel and RMS on your license or mine