

03 Geology Services
Mapping & Volumetrics
Thickness maps, zone averages and in-place volumes by fault block that survive peer review in structurally complicated fields.
Deliverable In-place and recoverable volumes by segment, with maps.
3.1
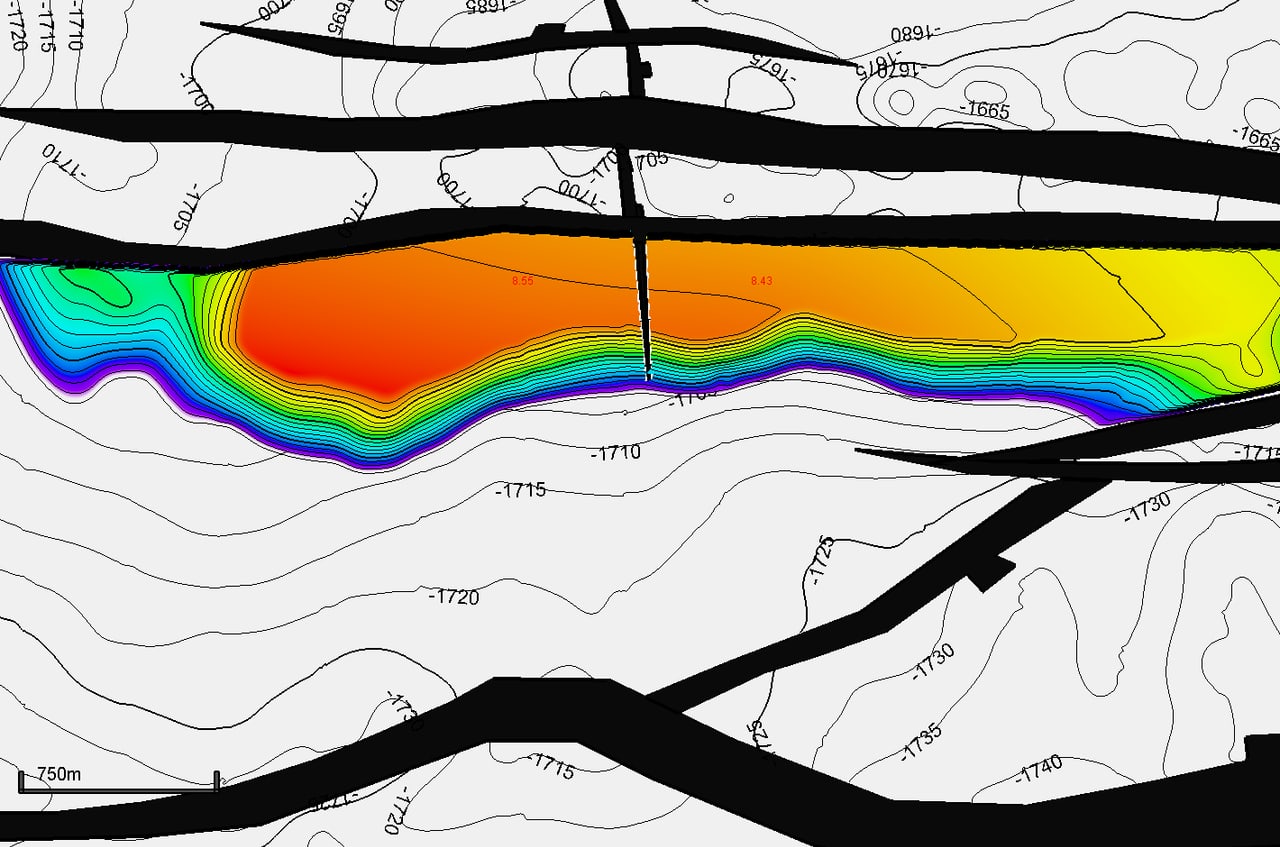
Bulk Rock Volume Assurance for Structurally Complicated Fields
Thickness that holds up across every fault, so your volumes do too.
Scope
- QC’d pointsets that sort unfaulted, reconstructed, do-not-use, outside-AOI and faulted-out data, listing the petrophysical attributes behind each zone average (same format as the WCD offer)
- Fixes for conformal gridding and fault-algorithm problems, so isopachs stay consistent across faults
- Consistent TST / TVT maps and a dip / azimuth model through the whole workflow
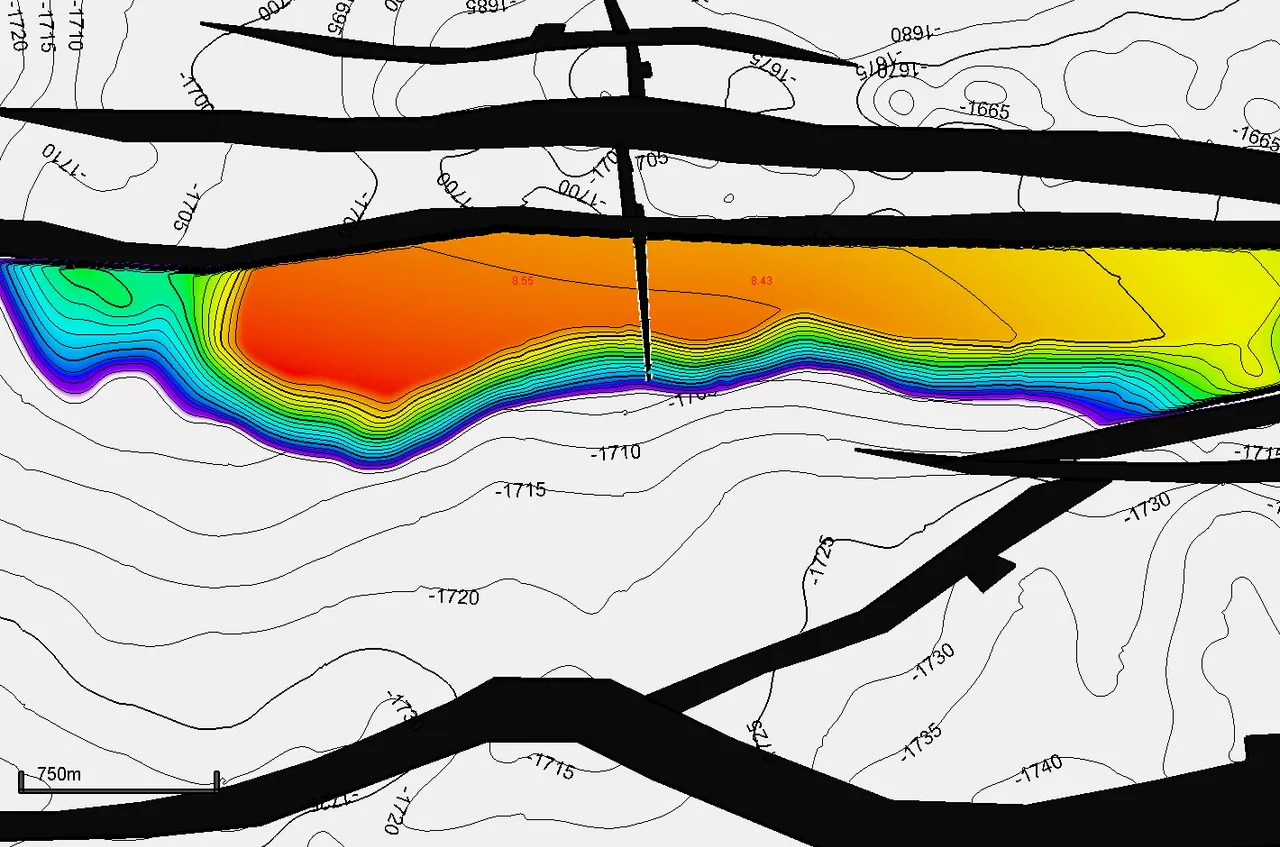
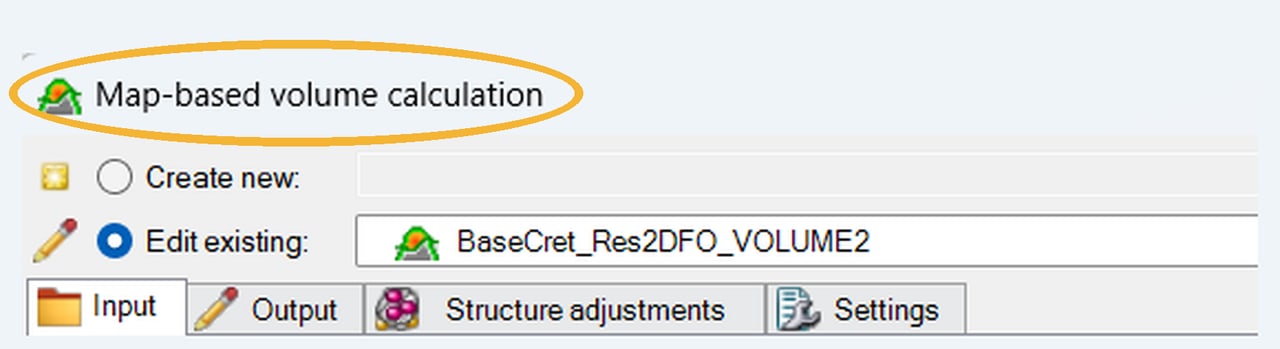
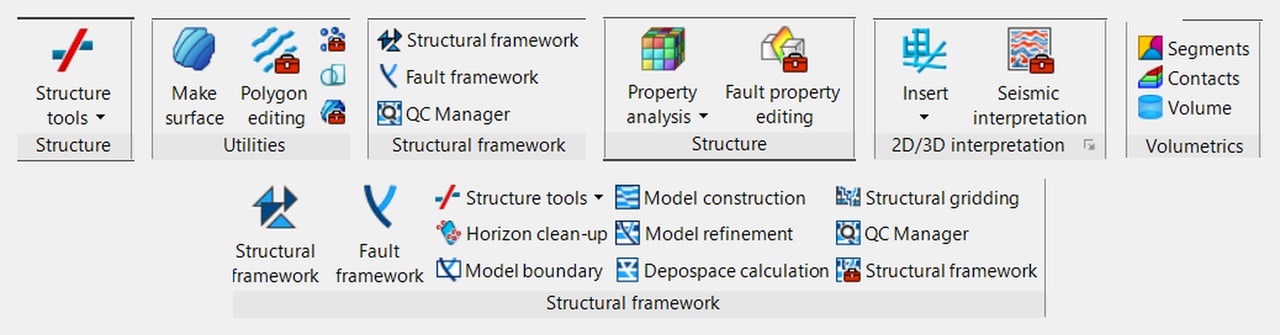
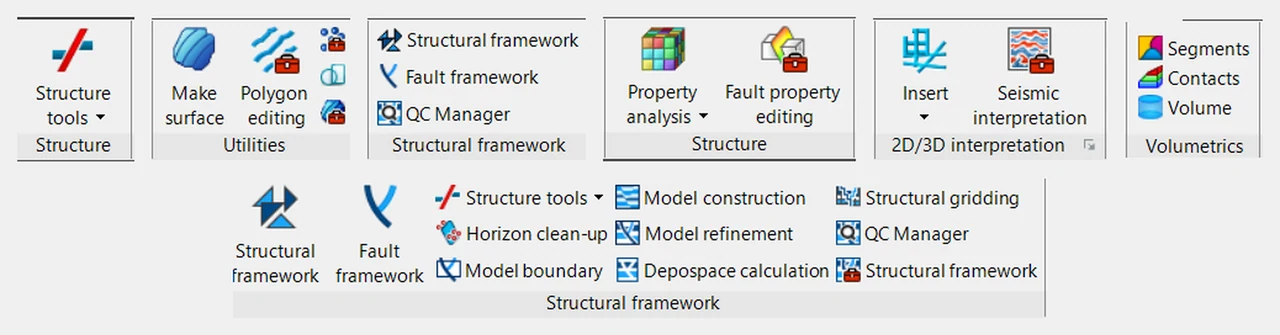
- Map-based volume calculation (MBVOL) in Petrel on the QC’d maps, by fault block and contact
Deliverable
QC’d thickness pointsets and maps, and a BRV that is consistent across faults.
Who it's for
Asset teams on faulted fields (salt-related deepwater especially) whose BRV or net-pay maps don’t survive peer review.
Proof
“Improved fieldwide volumetric description and the full-field simulation model by updating thickness maps, property maps, dip/azimuth datasets, and data management.”
What I'm Really Good At
- Every fault BRV holds up across each one
- TST / TVT consistent maps through the workflow
- MBVOL map-based volumes by fault block and contact
Thickness mapping in structurally complicated fields is where I add the most value: I find where gridding and fault algorithms distort isopachs and fix them, so BRV holds up across every fault. At BP my updates to thickness maps, property maps and dip/azimuth datasets improved fieldwide volumetrics and the full-field simulation model.
3.2
2D Map-Based Volumetrics: Independent Volumetric Assurance
A second set of expert eyes on your in-place numbers, before they go on the books.
Technical assurance, not a certified reserves audit.
Scope
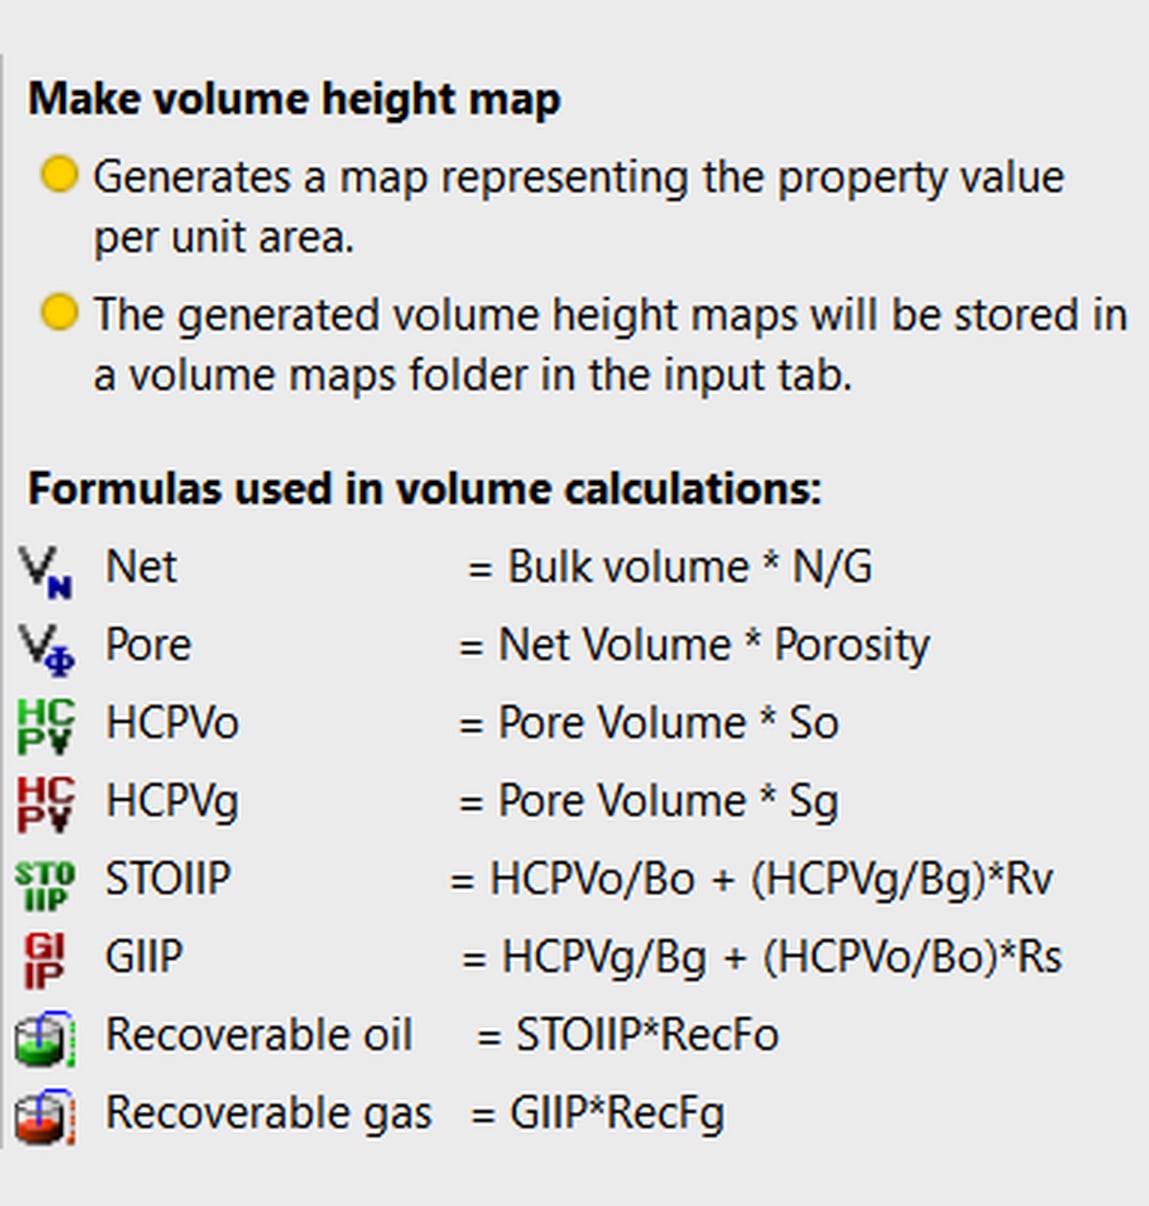
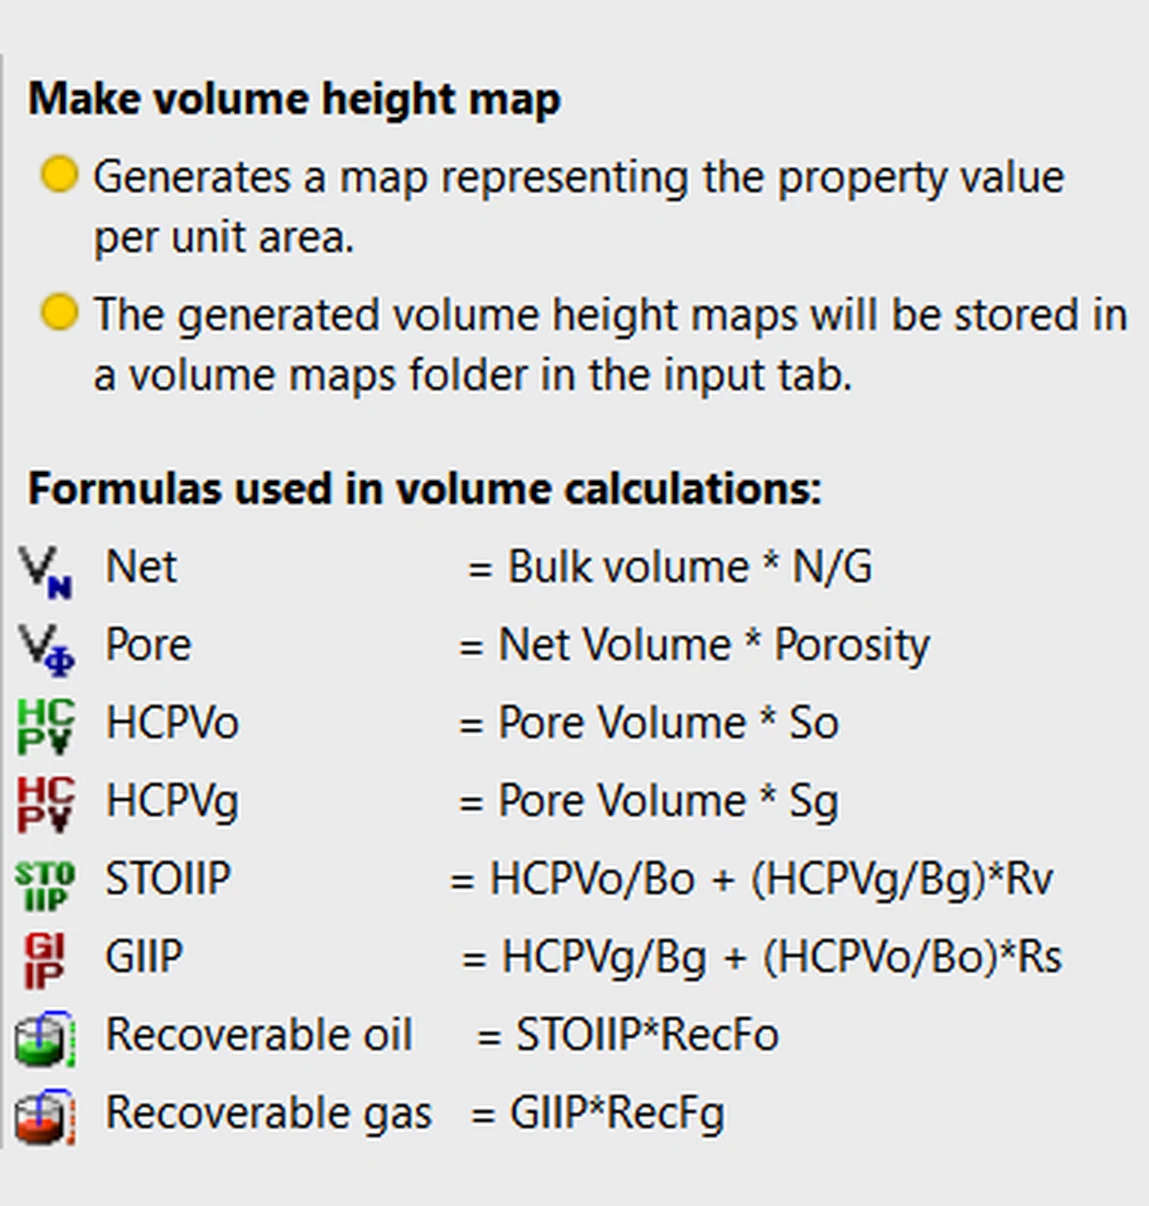
- The STOIIP chain: Net = BV × N:G; Pore = Net × PHI; HCPV = Pore × So; STOIIP = HCPV ÷ Bo (GIIP via Sg / Bg); recoverable = STOIIP × RF
- Your choice of speed vs. depth: fast 2D map-based volumetrics, or full 3D volumetrics with detailed net-pay maps built on a structural framework model
- Deterministic and probabilistic volumes from 2D maps and 3D grids in Petrel; 2D map calculator handling OWCs, GOCs and transition zones
- Workflow-editor reruns as contacts and assumptions change
Proof Developed an integrated method to include perched-water risk directly in volumetric calculations.
Deliverable
Independent STOIIP / GIIP with a clear audit trail of inputs.
Who it's for
Operators, partners and investors who need an independent check on STOIIP / GIIP and ranges.
Engagement
Independent technical assessment supporting your reserves process, or Senior Advisor assurance on your team’s own model. Technical assurance, not a certified reserves audit.
What I'm Really Good At
- 2D map-based, for a fast answer
- 3D full volumes and detailed net-pay maps
- STOIIP / GIIP independent, with an audit trail of inputs
I follow your preference on speed versus quality: 2D map-based volumetrics when you need an answer fast, or full 3D volumes and detailed net-pay maps built on a structural framework model. At BP I delivered Petrel map-based volumes for reserves reporting.
3.3
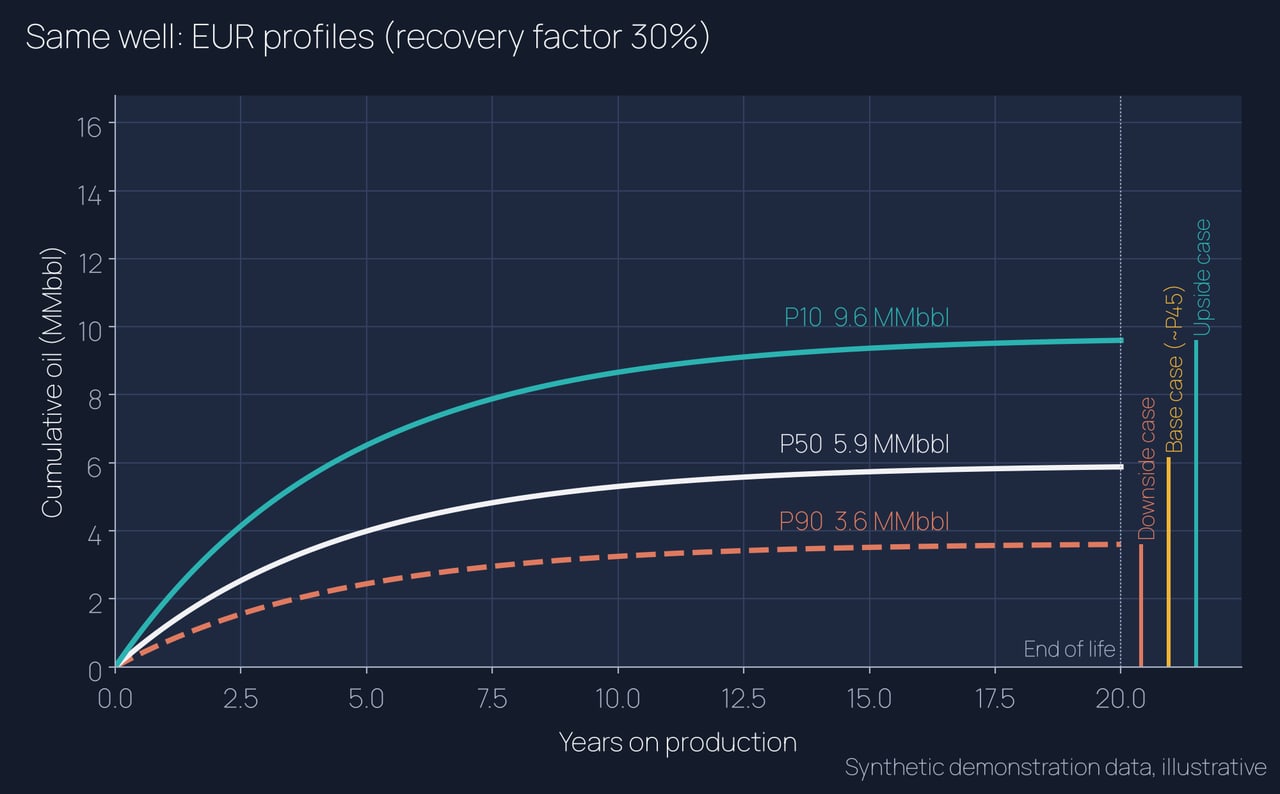
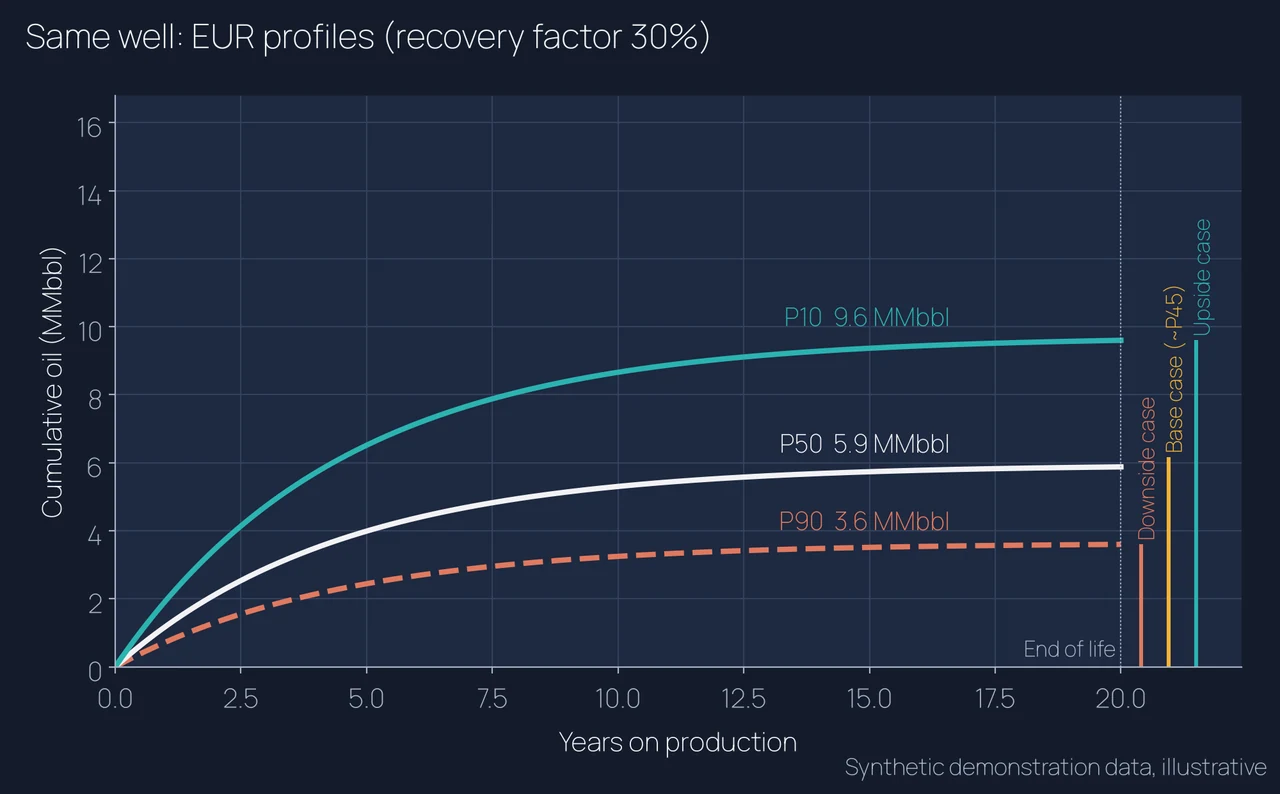
Volume Ranges by Segment: P90 / P50 / P10
In-place and recoverable ranges, by fault block, that the whole team can read.
Scope
- Cases built in order: pessimistic minimum, optimistic maximum, then reference
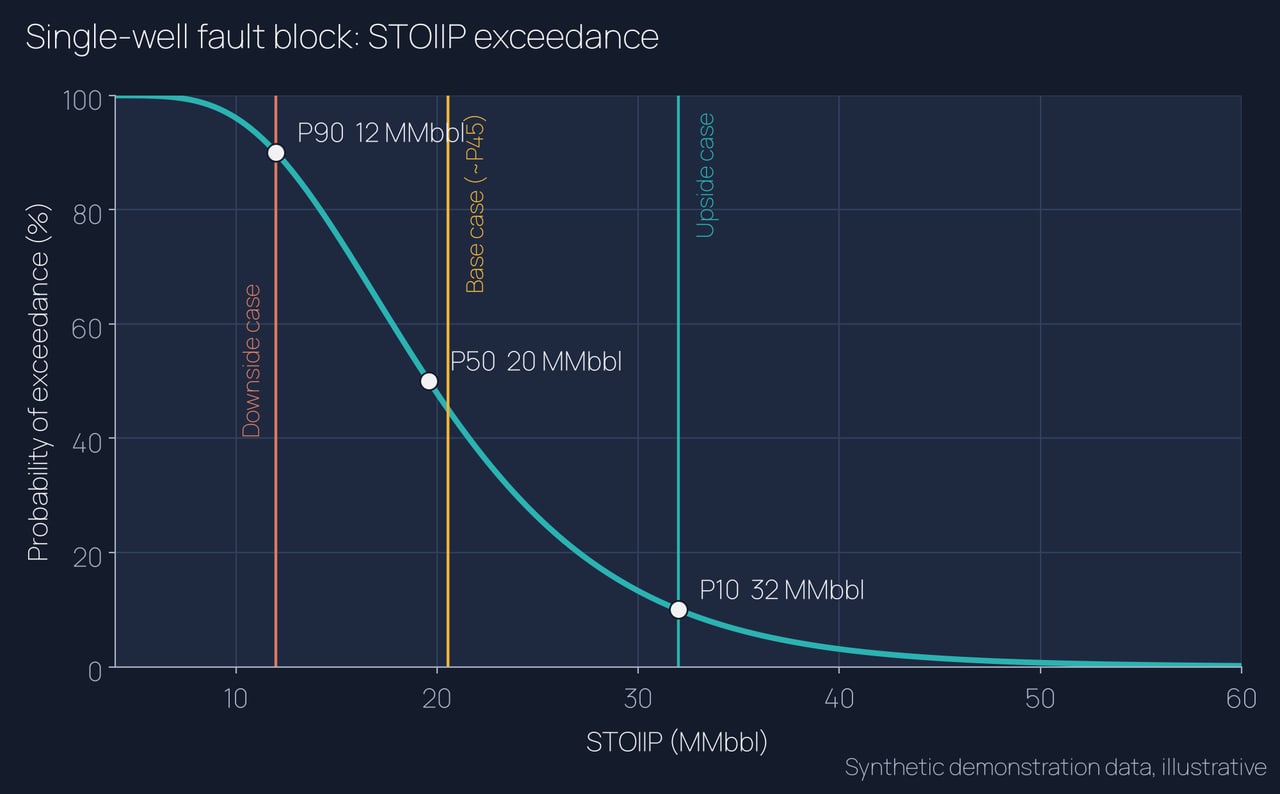
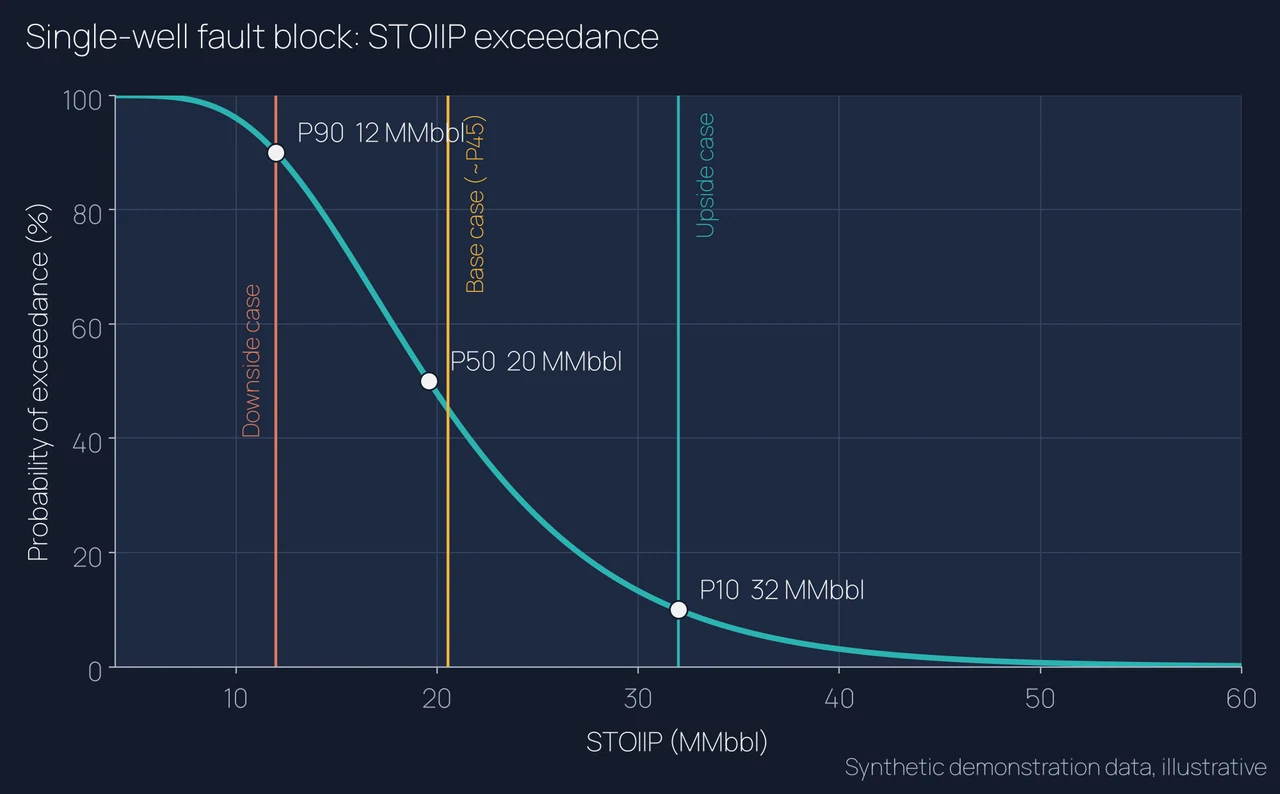
- P90 / P50 / P10 results with the deterministic cases plotted on the same charts
- In-place and recoverable volumes by segment and contact case
- Depth, thickness, N:G, porosity, Sw and HC-column maps by fault block
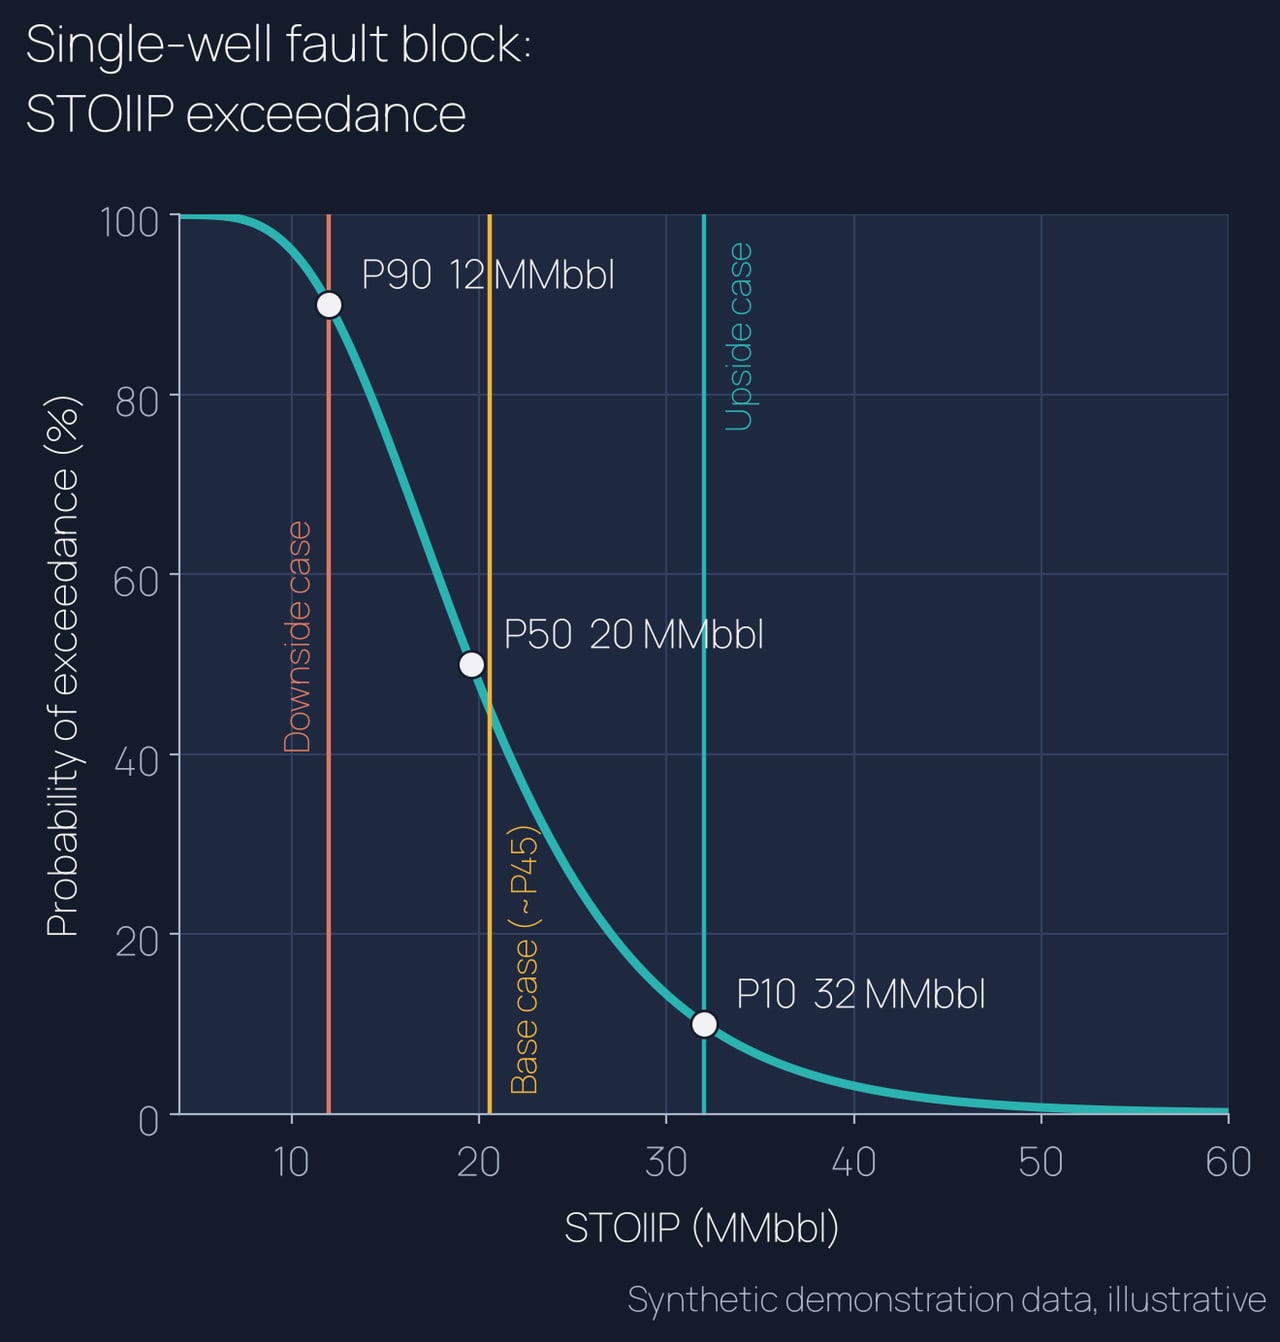
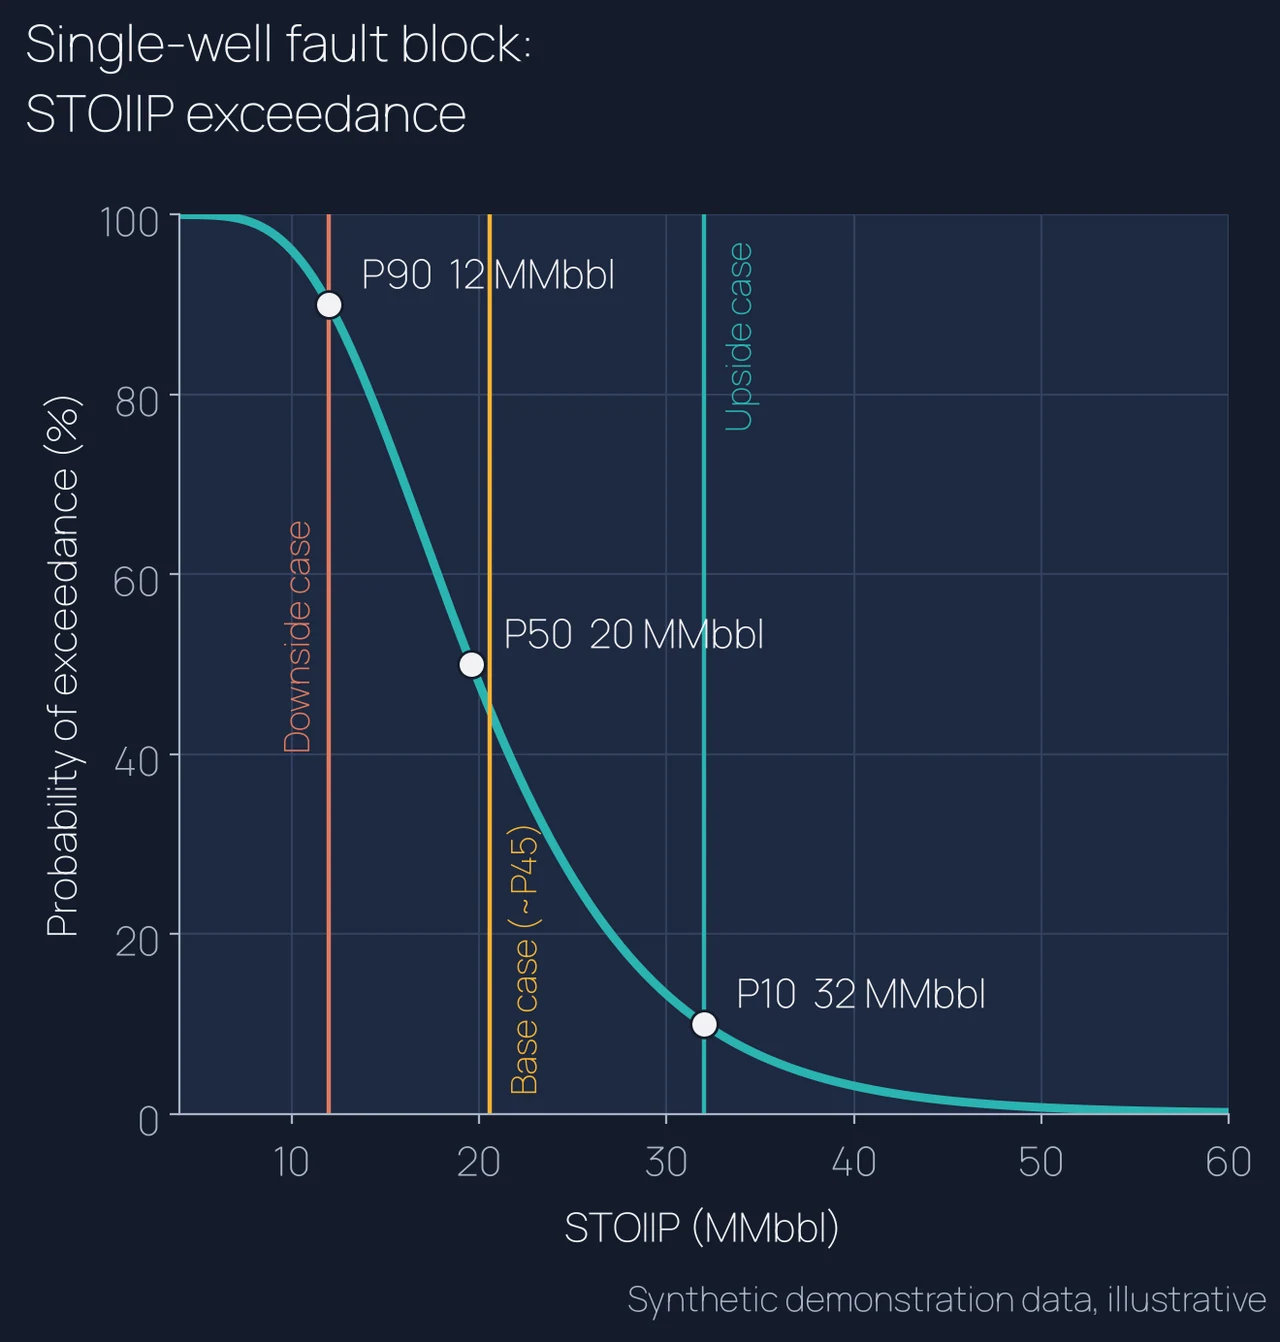
- Qualitative downside, base (~P45) and upside cases set against the P90 / P50 / P10 curves for STOIIP and EUR
Deliverable
In-place and recoverable volumes by segment, with maps and range charts.
Who it's for
Operators, partners and investors weighing development or acquisition decisions.
Proof
“Delivered full-field static descriptions and Petrel map-based volumes for reserves reporting,” including “perched-water habitat characterization, and fluid-contact uncertainty framing.”
What I'm Really Good At
- Minimum pessimistic case first
- Maximum optimistic case next
- Reference built last, inside the range
I bracket the extremes before building the reference case, so the range is honest. At BP I framed fluid-contact uncertainty and perched-water habitats, pulling maps, contacts and zone averages into one consistent set of volumes.
Synthetic demonstration data: all datasets shown were built solely for demonstration purposes and are not client data.
How to engage
Start small, prove value on one block, then scale. Fast turnaround, remote, Houston-based.
30-minute fit call
We walk through your field, data and decision. You leave with a clear view of where the subsurface risk sits and whether I am the right fit.
Fixed-scope pilot
One fault block or one zone, fixed price and fixed scope. You see my framework, zone averages, maps and QC on your own data before committing further.
Full study
Field-wide framework, correlation, mapping and volumetrics, with handoff-ready grids for reservoir engineering.
Remote delivery · Houston, TX · Petrel and RMS on your license or mine